Pece
Users' Diaries
Recent diary entries
Posted by King edgar on 24 April 2024 in English.
The SMCoSE YouthMappers Chapter, renowned as one of Tanzania’s largest mapping communities, hosted a transformative mapathon on April 14, 2024, at the esteemed Sokoine University of Agriculture. This event marked a pivotal moment of collaboration, extending invitations to other YouthMappers chapters in Morogoro, thus amplifying the inclusivity and impact of the initiative. Central to the mapathon’s objective was the concerted effort to contribute to Project #15530 within the HOT Tasking Manager, focusing on mapping cities across the Eastern and Southern Africa Region. By leveraging the power of open data, participants aimed to craft detailed base maps crucial for diverse applications, ranging from urban planning to efficient disaster response strategies.
Amidst an atmosphere described as “fantastic,” the event witnessed a remarkable accomplishment, the successful mapping of approximately 25,000 buildings. This feat not only underscores the collective dedication of the participants but also showcases the tangible outcomes of community-driven endeavors. Moreover, the mapathon served as a platform for new mappers to acquaint themselves with essential mapping tools such as ID Editors and JOSM, empowering them to contribute meaningfully to the OpenStreetMap ecosystem.
Special recognition is duly owed to the Open Mapping Hub Eastern and Southern Africa (OMHESA) for their unwavering support, notably through the prestigious Spatial People Award. This acknowledgment not only highlights the significance of collaborative partnerships but also accentuates the pivotal role of organizations in facilitating impactful mapathons and community initiatives. In essence, the event epitomized the ethos of collaboration, learning, and contribution inherent within the mapping community, further advancing the cause of open data dissemination and spatial awareness in the region.
In conclusion, the SMCoSE YouthMappers Chapter’s mapathon stands as a testament to the transformative potential of collective action in harnessing the power of mapping for societal benefit. It exemplifies how collaborative efforts can foster tangible change, driving forward the agenda of open data accessibility and spatial literacy within Tanzania and beyond. “We don’t just build maps, we build Mappers”
Posted by Beth Tapetes on 24 April 2024 in Brazilian Portuguese (Português do Brasil).
Beth Tapetes
Theatro da Paz, Belém/Pará - Brasil

O Theatro da Paz foi fundado em 15 de fevereiro de 1878, durante o período áureo do Ciclo da Borracha, quando ocorreu um grande crescimento econômico na região amazônica. Belém foi considerada “A Capital da Borracha”. Mas, apesar desse progresso a cidade ainda não possuía um teatro de grande porte, capaz de receber espetáculos do gênero lírico. https://www.theatrodapaz.com.br/
Credito da Foto; Wikipedia, https://pt.wikipedia.org/wiki/Wikip%C3%A9dia:Wiki_Loves_Par%C3%A1#/media/Ficheiro:Teatro_da_Paz_3.jpg Theatro da Paz, Belém/Pará - Brasil
Mais um ponto turístico da cidade de Belém atualizada na plataforma OpenStreetMap https://www.openstreetmap.org/changeset/150449820 através do projeto #MapeaiaBelem, https://projetomapeiabelem.my.canva.site/home que tem como objetivo disponibilizar dados atualizado para todos a comunidade local e também para aqueles que estarão presente aos grandes eventos que acontecerá entre 2024 e 2025, #SOTMLATAM #FOSS4G #COP30 sem contar que esses dados poderá ser utilizado por todos através de APPs como OsmAnd entre outros apps.
2024, SotM_Latam2024, FOSS4G 2024 , Belém, Cop30Belém
Projeto MapeaiaBelem,
Site do Projeto Mapeia Belém. https://projetomapeiabelem.my.canva.site/home Objeto mapeado no Openstreetmap, https://www.openstreetmap.org/changeset/150449820
esse é mas um projeto da UMBRAOSM - União dos Mapeadores Brasileiros do Openstreetmap
site: www.umbraosm.com.br
Instagram: https://www.instagram.com/umbraosmbrasil/
E-mail: contato@umbraosm.com.br

Quelque ajustements autour de moi et de mes destinations régulières.
ウミディグダの実装に伴うバイオーム「砂浜」が話題になっている。
砂浜がちゃんと編集されているところは海なし県ではほとんどない。
かつての公園のように簡単にはいかず、難しいところ。

Im Telegram-Kanal entdeckt, dass man in Overpass eine Abfrage schreiben kann, die alle Element anzeigt, die man mal bearbeitet hat:
[out:json][timeout:125];
(nwr(user_touched:"AlexSpritze")({{bbox}});)->.mine;
.mine->._;
// print results
out geom;
Dank an M. Brandtner und dieterdreist.

I am currently on a visit to Ireland 🇮🇪 and a lack of proper office space makes it difficult to stay productive. I will try to prepare something cool to show off this week. Sorry for keeping you waiting!
🍟

Camino vecinal, punto de marcación y edificio para centro de yoga Millaray Yoga.

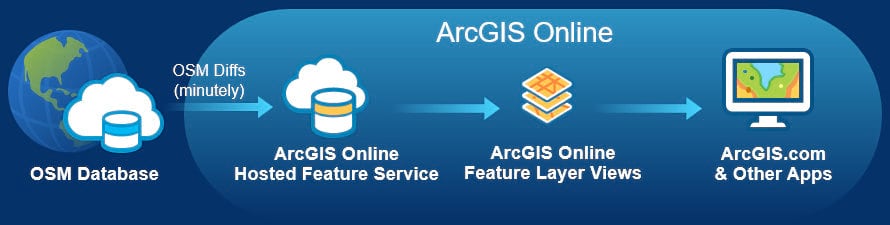
Why is OpenStreetMap ID not updated like OpenStreetMap ArcGIS?
These are two different datasets that need to be linked/updated!
Is ArcGIS taking over for OpenStreetMap and requiring a fee?
ArcGIS needs to update OpenStreetMap ID if they participate!
OpenStreetMap ArcGIS has not updated dataset in months!
Please help with coordinating these two data set updates!
Otherwise this in-browser edition will soon be obsolete!
Use ArcGIS to compare your area with the link listed: ArcGIS OSM
Are there any differences? Can anyone explain why?
On the ArcGIS OSM there are more buildings that they imported from datasets.
They should have updated the OSM ID data sets to match their information.
Now there is a ArcGIS OSM version 2 that appears to be replacing ID OSM…
parco circonvallazione
Posted by Raquel Dezidério Souto on 21 April 2024 in Brazilian Portuguese (Português do Brasil).
Last updated on 30 April 2024.
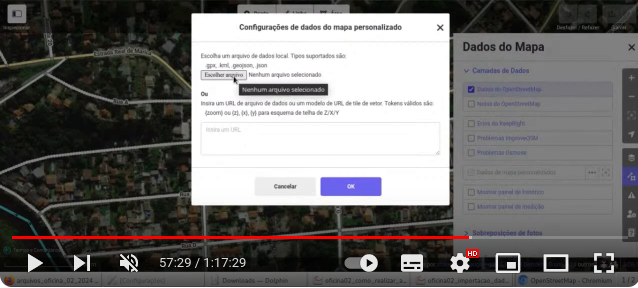
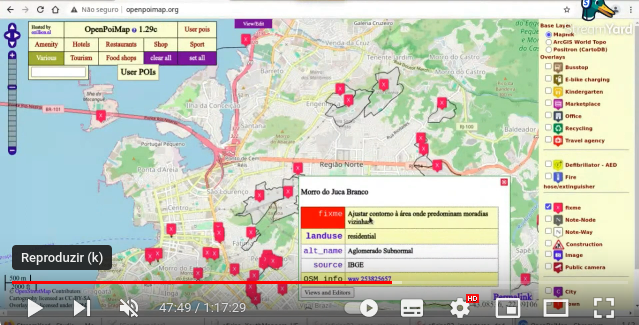
IVIDES.org® realizou oficina sobre importação de POIs no OSM a partir de arquivo de dados do Censo Demográfico do Brasil 2022
O Instituto Virtual para o Desenvolvimento Sustentável promoveu uma oficina sobre importação de pontos de interesse (POI) no OpenStreetMap, a partir de um arquivo de valores separados por vírgula (.csv).
O conteúdo abrangeu os pontos de interesse obtidos do conjunto de dados do Censo Demográfico 2022, mas os organizadores salientam que a rotina pode ser utilizada para a importação de outros tipos de pontos geocodificados no OpenStreetMap.
Todos os arquivos da apresentação podem ser encontrados no portal do treinamento, que inclui também a agenda dos demais encontros.
https://ivides.org/oficinas-mapeamento-openstreetmap
Um agradecimento especial ao público participante ao vivo e aos(às) participantes futuros desta ação! Agradecemos ainda aos nossos parceiros: HUB YouthMappers Rio de Janeiro, YouthMappers Brasil, YouthMappers Internacional e os laboratórios associados - Laboratório de Cartografia - GeoCart-UFRJ, Laboratório ESPAÇO de Sensoriamento Remoto e Estudos Ambientais - Espaço-UFRJ, Laboratório integrado de Geografia Física Aplicada - LiGA-UFFRJ e Laboratório de Modelagem Geográfica - LabModel UERJ. E também ao Victor Hugo Timotheo, que participou da transmissão, no apoio técnico.
IVIDES.org® é uma marca registrada. Para entrar em contato sobre esta ação: ym.ufrj@gmail.com.
A gravação da sessão pode ser encontrada no canal do IVIDES.org® no YouTube.
O DOWNLOAD DOS ARQUIVOS DA OFICINA está disponível! – Arquivo da apresentação e arquivos extras.
P.S.: Sobre os dados de latitude e longitute, que foram mantidos como estiquetas no conjunto de dados da oficina, está incluída uma justificativa no arquivo da apresentação e na sessão gravada e disponível no YouTube. A wiki OSM informa que tais etiquetas são “descartáveis”, porém mantivemos os dados das coordenadas para facilitar as oficinas de validação que serão realizadas pelo YouthMappers UFRJ, após este estágio de mapeamento colaborativo dos pontos de interesse.
![]()
![]()

Introduction
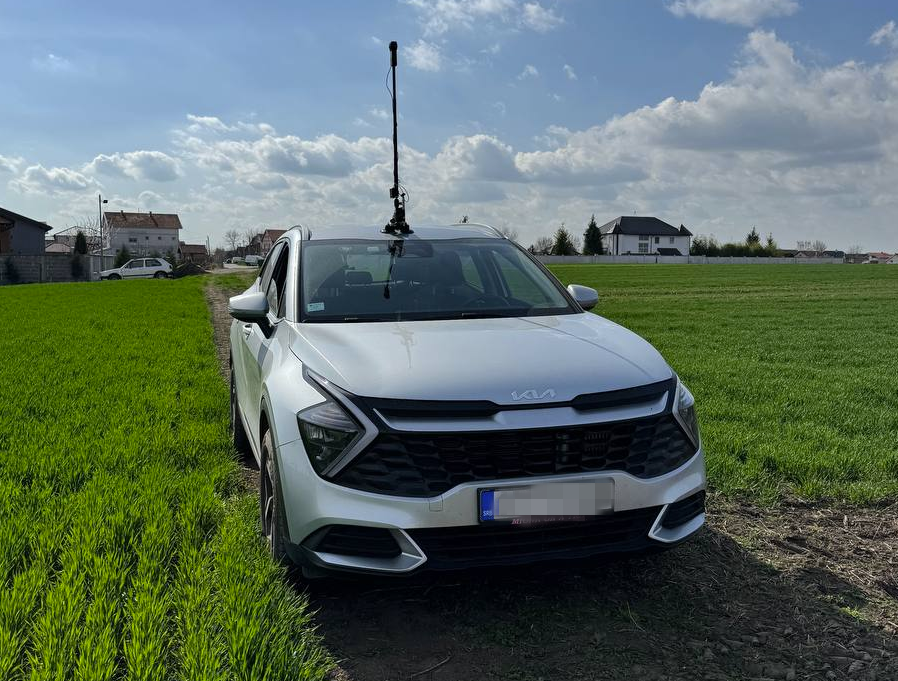
In this post, I will try to explain my process how to get best out of Insta360 ONE RS 1-inch camera and successfully upload images to Mapillary. It started out of my frustration of dealing with this camera and Mapillary and I hope you will not have to go through what I have been🙂. I will be focusing here more on software side (how to deal with data) rather than on hardware side (how to set up rig for image capture).
Let me first start with disclaimer that this is not easiest camera to work with Mapillary (hence this guide) and that not even Mapillary is recommending it. It definitively captures better images than GoPro 360, but everything with GoPro is more smooth over whole process, so be aware of this. Camera needs to record in video mode and it relies on additional GPS dongle you have to buy.
This guide assumes familiarity with Python and Linux. Most steps are optional, and you can treat everything as pure recommendation, and while you can always ping me to help you, beware that some technical knowledge (and determination🙂) is needed if you want to extract highest quality from this camera.
Capturing street view
First, you will need another hardware - “GPS Action Remote” with this. In theory, you don’t need it, as you can record with phone (or some other device), but in practice - you just turn on this remote and it works. With phone, you need to have Insta app turned on all the time, worry about display, whether app will get killed by battery optimizations, GPS reception inside car…. I decided to keep my sanity and use this little gadget. It will record GPS (poorly). Connect them and pair them and you can control camera through this remote. Once it show green, it means it is connected to camera and it acquired GPS signal.
Mapillary is suggesting to capture images in timelapse mode. If you do this, you will not get any GPS data (that is - you will get first coordinate and that lat/long will be on all images, so unusable). With this camera, you have to record in video mode. This will result in larger files, more drained battery and prolonged post-processing, but hey - at least it will work. You can expect 1h 10 min of recording if you fully top up battery.
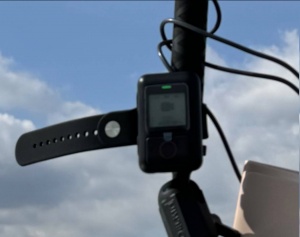
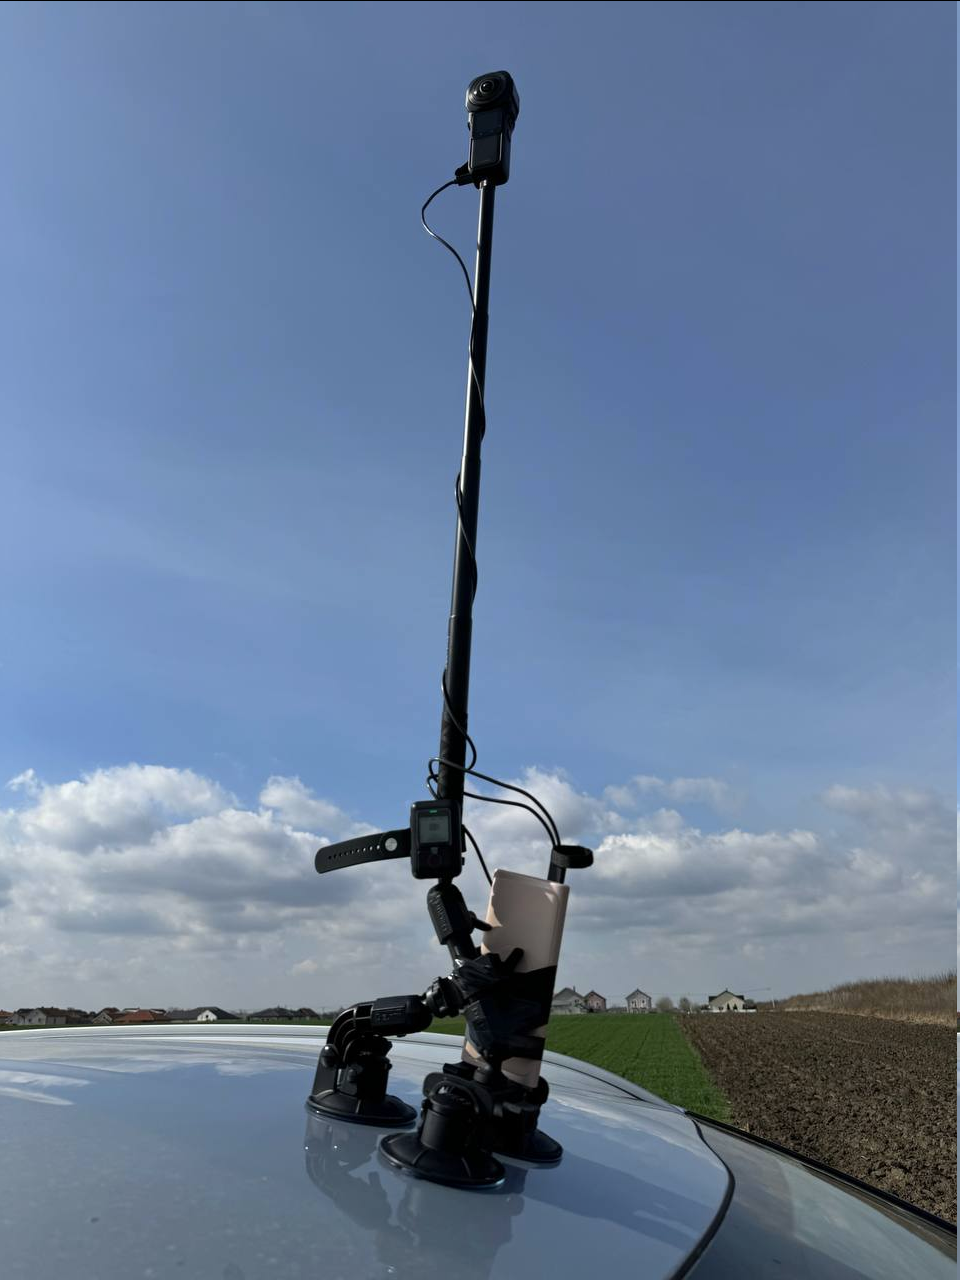
If you are using it outside of car, you can strap both GPS remote and additional battery altogether (watch for hot days and direct exposure of battery to the sun!), but I recommend to go out every 10-20 minutes and check if tripod is holding good. If you are like me and you want to be anonymous and don’t like to be captured by camera, every time you go out, do stop and start video recording again. If you just have one large video, it will be harder to remove yourself (but not impossible), so consider doing this. If you don’t care if your head is in video, then no need for this. This is example how our setup looked like:
If you do not want to do video splitting, you will have to keep your video under 7-8 minutes! If you go over this time, you will have to cut them in post-processing as Mapillary cannot ingest video larger than 8 minutes.
Getting video and track
Once you go home, you will end up with .insv files. Download and open Insta360 Studio application. Import this .insv file. You can adjust quality of image if you want. I usually cut beginning and end of video to only parts where I am driving. If I went outside of car and were checking tripod, I also cut those parts (you cannot cut parts of video, but you can export same video multiple times with different start/end cut times). Once satisfied with cutting, export video. Important thing here is to check “Export GPX track”.
If you don’t want to deal with Linux and cutting video/gpx later, this is your time to cut video into 5-6 minutes segments. Anything larger than this increases probability that Mapillary processing will fail (anything above 8 minutes is impossible to be processed).
At the end of the process, you should end with one .mp4 video file and one .gpx track file. Let’s call them input.mp4 and input.gpx.
Fixing GPX track (optional)
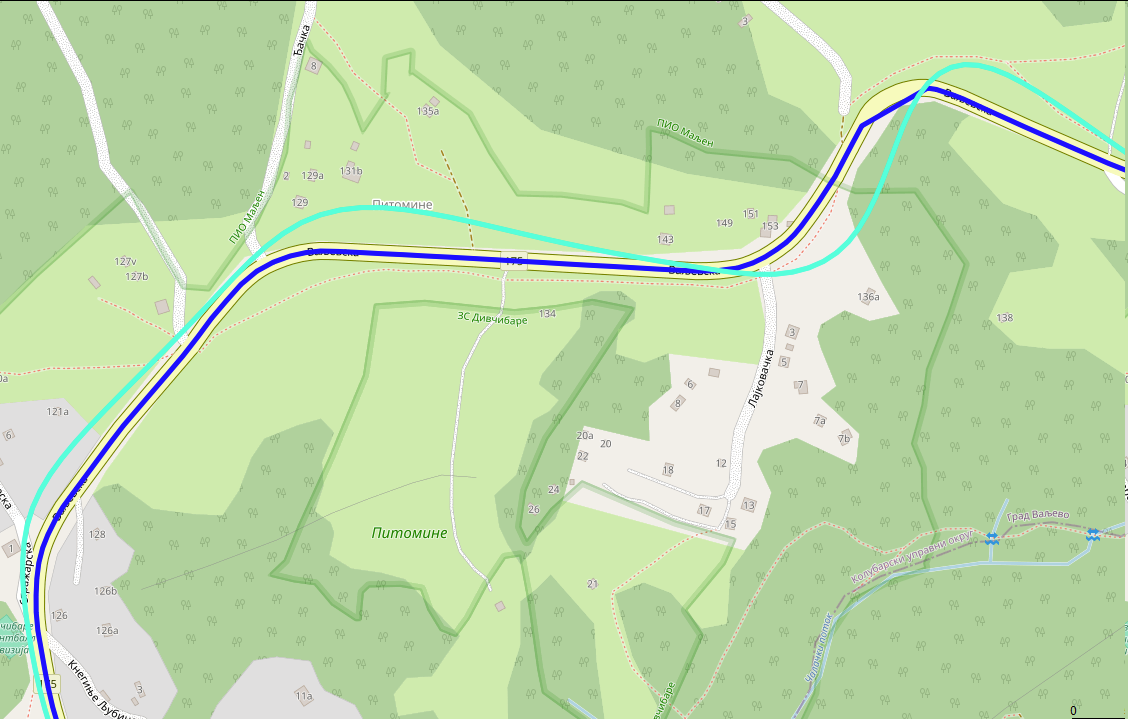
GPX that is recorded with this “Action Remote” dongle is crime against all scientist, engineers, mechanics and everyone who worked hard to give us ability to know where we are using GPS. For this part, you will need to run Python program. If you can live with poor GPS, no need to fix anything, but I just couldn’t. Here is how it looks before (turquoise color) and after (blue color) processing:
What I did is I used Geoapify platform to do map matching of GPX for me. This is process where you snap GPX trace to closest road. It is really hard problem and I found that Geoapify do very good job converting this Insta360 mess of GPX and their free pricing is more than enough (not affiliated with them, just found them good and easy to work with). First go to their website, sign in and obtain API key (click “New Project”, type any name and on next dialog, just remember generated API key). Here is simple Python script that will take your input.gpx, send it to Geoapify for map matching and then update original .gpx to have new points (while keeping all other attributes like time the same):
import xml.etree.ElementTree as ET
import json
import requests

ET.register_namespace('', 'http://www.topografix.com/GPX/1/1')
ns = {'': 'http://www.topografix.com/GPX/1/1'}

def gpx_to_json(input_filename):
    converted_gpx = {'mode': 'drive', 'waypoints': []}
    tree = ET.parse(input_filename)
    root = tree.getroot()
    trksegs = root.findall('.//trkseg', ns)[0]
    for trkseg in trksegs:
        converted_gpx['waypoints'].append({
            'timestamp': trkseg.find('time', ns).text,
            'location': [float(trkseg.attrib['lon']), float(trkseg.attrib['lat'])]
        })
    return converted_gpx

def do_mapmatching(input_json):
    url = "https://api.geoapify.com/v1/mapmatching?apiKey=<YOUR_APIKEY>"
    headers = {"Content-Type": "application/json"}
    resp = requests.post(url, headers=headers, data=json.dumps(input_json))
    if resp.status_code != 200:
        raise resp
    return resp.json()

def adopt_gpx(input_gpx_filename, mapmatched_json, output_gpx_filename):
    # Load original GPX and segments
    tree = ET.parse(input_gpx_filename)
    root = tree.getroot()
    trksegs = root.findall('.//trkseg', ns)[0]

    # Load mapmatched segments
    waypoints = mapmatched_json['features'][0]['properties']['waypoints']

    assert len(waypoints) == len(trksegs)

    # Change location in original gpx and save it
    for waypoint, trkseg, i in zip(waypoints, trksegs, range(len(waypoints))):
        assert i == waypoint['original_index']
        trkseg.attrib['lon'] = str(waypoint['location'][0])
        trkseg.attrib['lat'] = str(waypoint['location'][1])
    tree.write(output_gpx_filename, default_namespace="")

if __name__ == '__main__':
    input_gpx_filename = 'input.gpx'
    input_gpx_as_json = gpx_to_json(input_gpx_filename)
    mapmatched_json = do_mapmatching(input_gpx_as_json)
    adopt_gpx(input_gpx_filename, mapmatched_json, 'output.gpx')
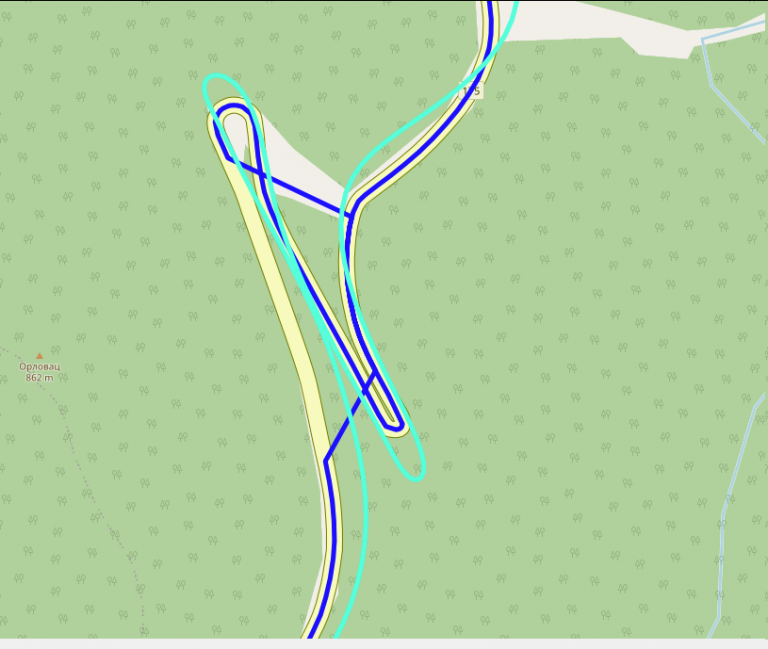
Save this code as “mapmatching.py”, change “YOUR_APIKEY” to value obtained from Geoapify, run it with python3 mapmatching.py with input.gpx in same directory. At the end of it, you should get output.gpx. Open this file in GPX editor of your choice and manually inspect it. Move any bogus points (it can happen, especially with hairpin roads) and save it - you can now use this .gpx instead of old one. I am using GpsPrune software (available for Linux too) to move points. Here is (rare) example where mapmatching can go wrong:
Splitting videos (optional)
If you ended with videos larges than 8 minutes, this is your time to cut them. I am using ffmpeg and exiftool command from Linux. This is command that will take input.mp4 and split it into out000.mp4, out001.mp4 … files, each up to 5 minutes in length. After that, I am using exiftool to bring back metadata from original video (just so it is nicer to play it in 360 mode in VLC, but I think it is not required for Mapillary):
ffmpeg -i input.mp4 -c copy -strict experimental -map 0:0 -segment_time 00:05:00 -f segment -reset_timestamps 1 out%03d.mp4
exiftool -api LargeFileSupport=1 -tagsFromFile input.mp4 -all:all out000.mp4 # repeat for other out*.mp4 files
Unfortunately, you will have to split .gpx manually (I could create Python script for this too if someone wants, but it was easier for me to just split it in text editor). That is - open .gpx in any text editor, observe time of first point, add 5 minutes to that value and remove all points that happened after exactly fifth minute. If you do this correctly and if you had video of 14 minutes and you cut it in 6 minute segments, you should end up with 3 video - 6 minutes, 6 minutes and 2 minutes as well as 3 .gpx traces - 6 minutes, another one with middle 6 minutes and another one with final 2 minutes. Do rename .mp4 and .gpx to have same names!
You are now ready to upload all these video using Mapillary Desktop Uploader. As long as names of .mp4 and .gpx are the same, you can just drag .mp4 file into Desktop Uploader app and it will show you trace and it will let you upload to Mapillary.
Producing images (optional)
In general, you don’t need this step. This is step if you want to convert video to bunch of images. Some of the reason you might want images:
- You don’t like how Mapillary is handling videos (street view images too close to each other), or
- you ended up with large videos that you cannot/don’t know how to split, or
- you have part of video that you don’t want in Mapillary at all, and you don’t want to split it in Insta Studio app all the time
- you don’t want to backup large videos, you would rather have images
- you have poor internet connection to upload those giant video files
In these cases, you can try to generate bunch of images from your videos and upload these. For this, mapillary_tools can help you, but it is not easy to get proper arguments. What I found that works for me is this set of options:
mkdir tmp/
mapillary_tools video_process ./out000.mp4 ./tmp/ --geotag_source "gpx" --geotag_source_path ./out000.gpx --video_sample_distance -1 --video_sample_interval 1 --interpolation_use_gpx_start_time --overwrite_all_EXIF_tags --interpolate_directions
Conclusion
I hope this guide could help you with this camera, if you plan to use it for street view. Feel free to ping me if you need help in any of these steps or if you find that something is missing, or that Mapillary made some things easier in the meantime! Big thanks to friends BrackoNe and borovac who borrowed me this camera and who took these pictures (and whose car this is🙂).

Buat masa sekarang saya masih kumpul maklumat kawasan untuk elak kesilapan.
Peraturan aman central menyukarkan saya untuk buat mapping di dalam.

En aout dernier, j’avais été surpris de la facilité avec laquelle j’étais devenu le contributeur n°1 en Grèce, via l’application StreetComplete.
Je viens d’accomplir la même chose, mais en contribuant sur la France.
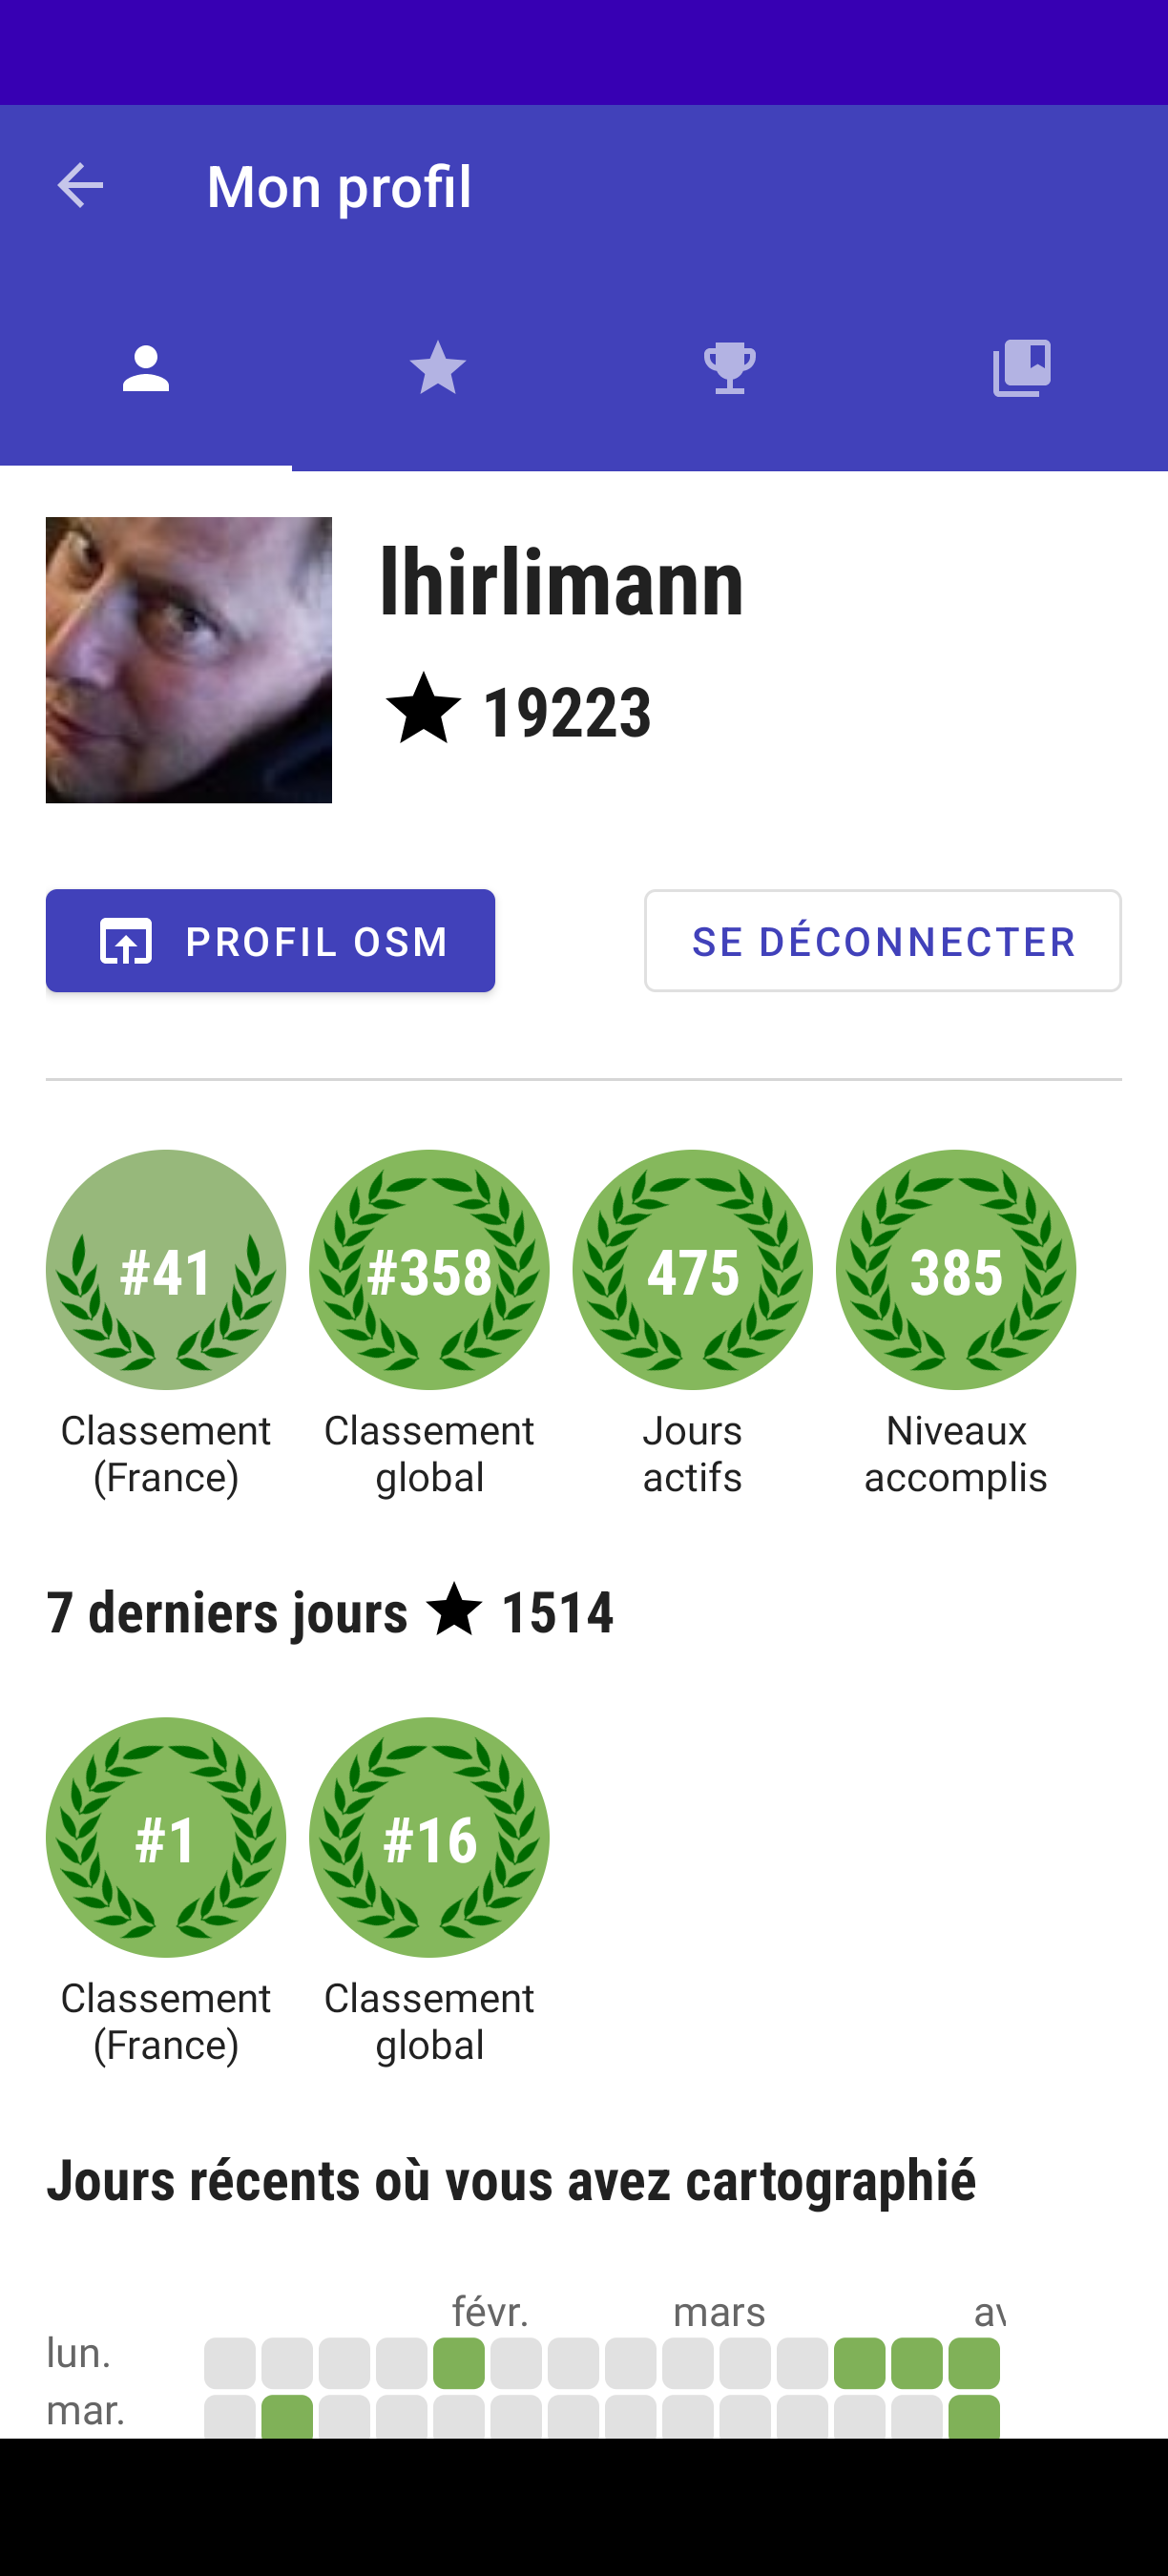
Comment mi suis-je pris :
- J’ai pris un endroit loin de chez moi, où je n’avais pas encore travaillé
- J’ai sept jours durant fait une sortie à vélo d’une heure avec StreetComplete et vesspucci
- j’ai tagué, j’ai ajouté et tagué
C’est aussi simple que cela et ne prend pas beaucoup de temps. Je ne reproduirai sans doute pas la chose, car près de chez moi, ça commence à faire un sacré trajet afin que je rentre dans des zones en besoin de tags.
Posted by Marcelo Soares Souza on 18 April 2024 in English.

We created a F-Droid repository for all Agroecology Map applications.
F-Droid is an open source app store and software repository for Android.
Agroecology Map is a Free Software, based on OpenStreetMap, citizen science platform that aims to assist in mapping and exchanging experiences in Agroecology.
- How to add the Agroecology Map F-Droid repository?
- Settings
- Repositories
- Add (+) Repository (https://fdroid.agroecologymap.org/repo/)
- Scan QR Code or Enter repository URL manually
Step-by-step https://youtube.com/shorts/4Cw3jPzmS2I?si=zYxrgR1fHMfHEDq7
私たちが使っているGoogle mapなどにはかず多くのレイヤーを用いて作られていると学びました。自分でマッピングすることが、日本地図を測量して初めて作った伊能忠敬のようでワクワクしています。ちなみに彼の記念館や屋敷、昔の街並みは千葉県の香取市にあり、「佐原の町並み」として観光地になっています。

Pipelines are notoriously tough to map. They lie mostly underground, often with little to no visible trace on aerial imagery. What may look like a pipeline route on the ground may actually be a tangled bundle of pipelines, and even if we can figure out an individual pipeline’s true route, imagery tells us nothing about its name, who operates it, or what substance it carries.
Fortunately, the Pipeline and Hazardous Materials Safety Administration (PHMSA), an agency of the U.S. Department of Transportation, publishes authoritative, open data on pipeline routes. The Public Viewer, however, presents this data as raster images and limits how far you can zoom in. Despite this, we can use it quite effectively to identify pipelines and trace their precise routes.
Workflow
Requirements: JOSM, with Expert Mode enabled (this can be found at the bottom of the View menu).
Choose a county
There are over 3,000 county-equivalents in the United States. You may want to start with a place you’re familiar with, an unreviewed pipeline found on TIGERMap, or an area where you suspect data is missing from Open Infrastructure Map. Regardless, we’ll be focusing on mapping one county (or parish, borough, independent city, etc.) at a time.
Download the county’s pipelines
In JOSM, open the Download window (Ctrl+Shift+Down). Choose the “Download from Overpass API” tab along the top (if this is missing, make sure Expert Mode is enabled and try again). Paste the following into the query field:
{{geocodeArea:"Loving County, Texas"}};
way(area)[man_made=pipeline];
(._; >; <;);
out meta;
Replace Loving County, Texas with the county-equivalent of your choice, and hit Download. Don’t worry about selecting a bounding box on the map; it will be ignored.
Now that you have a canvas to work with, you’re ready to get started mapping.
Open the county in PHMSA’s Public Viewer
Open the Public Viewer and enter your state and county. You’ll find two layers enabled by default: Gas Transmission Pipelines and Hazardous Liquid Pipelines.
Right-click on a pipeline and select a layer in the Identify menu. The pipeline becomes highlighted in yellow, and a box pops up with details about the pipeline, including name, operator and commodity (see substance=*).
If your county has only a few pipelines, then this should be enough to work with. But if you encounter several pipelines tangled together, queries can help sort them out.
Untangle pipelines with queries
Click on Query Tools, then Query Pipelines. Pipelines can be queried based on various attributes, such as OPID (operator) or commodity. But for this exercise, we’ll be doing a spatial query. Near the bottom of the window, choose Draw an Area, and click the following button.
Find a cluster of pipelines, and click on the map to add corners of a polygon surrounding the bundle. Double-click to add your last point and finish.
Check the box for “Also display attributes in a table”, and hit OK. A new layer will appear on the map containing only the pipelines passing through the selected polygon, and a box will pop up with the details of each pipeline.
Select a row in the table, and then click the Highlight Selected Feature button below. The pipeline will show up yellow on the map.
Helpful Hints
- Add as many imagery layers as possible in JOSM. Cycle through them with the backtick key (above Tab) as you map. You may find that one imagery source is good for a particular pipeline, but another source is better for a nearby pipeline (perhaps they were laid and photographed years apart).
- It’s okay (and inevitable, really) to leave a pipeline unfinished. Just add
fixme=continueto the node at the end.
Posted by SeverinGeo on 17 April 2024 in English.
English below / Português abaixo
Dans mon précédent post, mon propos visait à promouvoir la cartographie de terrain comme première activité concrète de cartographie OSM proposée à des débutants, plutôt que l’hégémonique cartographie des bâtiments, mais pas du tout à dénigrer la cartographie des bâtiments en tant que telle : alors que certaines personnes dans la communauté voient essentiellement OSM comme une base de données de navigation et jugent les bâtiments comme un objet secondaire voire assez inutile, pour ma part, je reconnais tout à fait leur importance pour divers aspects, comme par exemple, participer à représenter (notamment avec les barrières et les arbres) ce qu’on appelle en géographie le tissu urbain, ou servir comme approximation de l’effectif d’une population. J’ai d’ailleurs enseigné pendant quelques années InaSAFE pour QGIS, qui utilise notamment les bâtiments OSM comme données de vulnérabilités, ou coordonné la cartographie de tous les bâtiments dans les préfectures et sous-préfectures de la RCA pendant la crise de 2012 -2014.
Pour autant, je ne fais pas des bâtiments l’alpha et l’oméga de la carto OSM, et en fait, surtout pas l’alpha. En effet, ce n’est pas le premier objet que je ferais cartographier sur imagerie par des débutants :
- Les bâtiments ne sont pas forcément des objets simples à cartographier et le sont en grande majorité avec iD, qui n’est pas conçu pour cela, ni n’a (malheureusement) jamais été modifié pour l’être.
- En dehors des zones rurales où les bâtiments sont espacés les uns des autres, la cartographie correcte des bâtiments implique de savoir placer précisément les nœuds, voire aligner les bâtiments entre eux. Redresser les bâtiments tordus et mal alignés faits en ville par les débutants est une des tâches ingrates des contributeurs expérimentés.
- Dans certains contextes urbains, avec un bâti serré et de plusieurs étages, leur cartographie est particulièrement complexe, même pour des cartographes expérimentés.
- Sur certaines images, les bâtiments sont peu visibles et le résultat forcément limité en qualité. • Si le besoin en données n’est pas immédiat, il peut être préférable d’attendre une image de meilleure qualité, tant le « remapping » prendra du temps.
Je conseille plutôt de faire commencer les débutants par la cartographie des routes :
- Le besoin de précision géométrique est moindre, on vectorise généralement à un niveau de zoom moins important.
- L’expérience est nettement plus enrichissante, car elle permet d’aborder les notions d’intersection et connectivité, d’accrochage, de nœuds utiles et de sur-extraction, ou encore de classes d’attributs.
- C’est également pour eux l’opportunité d’apprendre les notions de contrôle qualité et de complétude de la donnée, à travers l’importance de la connexité pur un réseau routier connexe, en travaillant par exemple sur les voies déconnectées du réseau principal, depuis Osmose ou Maproulette.
- Une cartographie de routes de qualité moyenne est plus facile à corriger (mode W sur JOSM par exemple) que celle de bâtiments, et nettement plus plaisante !
In my previous diary post, my aim was to promote terrain mapping as the first concrete OSM mapping activity offered to beginners, rather than the hegemonic mapping of buildings, but not at all to denigrate the mapping of buildings as such: While some people in the community see OSM essentially as a navigation database and consider buildings to be a secondary or even fairly useless object, for my part, I fully recognise their importance for various aspects, such as helping to represent (particularly with fences and trees) what in geography is known as the urban fabric, or serving as an approximation of the size of a population. I also taught for a few years InaSAFE for QGIS, which uses OSM buildings as vulnerability data, or coordinated the mapping of all the buildings in the prefectures and sub-prefectures of the CAR during the 2012-2014 crisis.
However, I’m not making buildings the alpha and omega of OSM mapping, and in fact, especially not the alpha. In fact, it’s not the first object that I’d have mapped on imagery by beginners:
- Buildings aren’t necessarily simple objects to map, and the vast majority of them are with iD, which wasn’t designed for this purpose, nor has it (unfortunately) ever been modified to be so.
- Apart from rural areas where buildings are spaced far apart, correct mapping of buildings involves knowing how to place nodes precisely, and even align buildings with each other. Straightening out the twisted and misaligned buildings made in town by beginners is one of the thankless tasks of experienced contributors.
- In certain urban contexts, with tightly-packed, multi-storey buildings, mapping them is particularly complex, even for experienced cartographers.
- In some images, the buildings are not very visible and the result is inevitably limited in quality. if the need for data is not immediate, it may be preferable to wait for an image of better quality, as remapping will take time.
I recommend that beginners start with hisghway mapping (roads, streets, paths…):
- There’s less need for geometric precision, and you generally vectorise at a lower zoom level.
- It’s a much more rewarding experience, because it introduces them to the concepts of intersection and connectivity, snapping, useful nodes and over-extraction, and tag classes.
- It’s also an opportunity for them to learn about the concepts of quality control and data completeness, through the importance of connectivity for a related road network, for example by working on roads disconnected from the main network, using Osmose or Maproulette.
- Mapping roads or streets of average quality is easier to correct (W mode on JOSM, for example) than mapping buildings, and much more pleasant!
Translated with DeepL.com (free version)
No meu post anterior, o meu objetivo era promover o mapeamento do terreno como a primeira atividade concreta de mapeamento OSM oferecida aos principiantes, em vez do hegemónico mapeamento de edifícios, mas não pretendia de todo denegrir o mapeamento de edifícios enquanto tal: Enquanto algumas pessoas na comunidade vêem o OSM essencialmente como uma base de dados de navegação e consideram os edifícios como um objeto secundário ou mesmo bastante inútil, pela minha parte, reconheço plenamente a sua importância em vários aspectos, tais como ajudar a representar (particularmente com vedações e árvores) o que em geografia é conhecido como tecido urbano, ou servir como uma aproximação da dimensão de uma população. Também ensinei durante alguns anos o InaSAFE para o QGIS, que utiliza os edifícios do OSM como dados de vulnerabilidade, ou coordenei a cartografia de todos os edifícios das prefeituras e subprefeituras da RCA durante a crise de 2012-2014.
Por tudo isso, não estou a fazer dos edifícios o alfa e o ómega do mapeamento OSM e, na verdade, especialmente não o alfa. De facto, não é o primeiro objeto que eu mandaria mapear em imagens por principiantes:
- Os edifícios não são necessariamente objectos simples de mapear, e a grande maioria deles são-no com o iD, que não foi concebido para isso, nem foi (infelizmente) alguma vez modificado para o ser.
- Exceto nas zonas rurais, onde os edifícios estão muito espaçados, mapear corretamente os edifícios significa saber colocar os nós com precisão e até alinhar os edifícios uns com os outros. Endireitar os edifícios torcidos e desalinhados feitos na cidade por principiantes é uma das tarefas ingratas dos colaboradores experientes.
- Em certos contextos urbanos, com edifícios de vários andares e muito compactos, a sua cartografia é particularmente complexa, mesmo para cartógrafos experientes.
- Em algumas imagens, os edifícios não são muito visíveis e o resultado é inevitavelmente limitado em termos de qualidade. se a necessidade de dados não for imediata, pode ser preferível esperar por uma imagem de melhor qualidade, uma vez que o remapeamento levará tempo.
Recomendo que os principiantes comecem pela cartografia rodoviária (estradas ou ruas):
- Há menos necessidade de precisão geométrica e, geralmente, a vectorização é feita com um nível de zoom inferior
- É uma experiência muito mais gratificante, porque lhes dá a conhecer os conceitos de intersecção e conetividade, encaixe, nós úteis e sobre-extração, e classes de atributos.
- É também uma oportunidade para aprenderem os conceitos de controlo de qualidade e exaustividade dos dados, através da importância da conetividade para uma rede rodoviária relacionada, por exemplo, trabalhando em estradas desligadas da rede principal, utilizando o Osmose ou o Maproulette.
- Mapear estradas ou ruas de qualidade média é mais fácil de corrigir (modo W no JOSM, por exemplo) do que mapear edifícios, e muito mais agradável!
Traduzido com DeepL.com (versão gratuita)